The Simetar© functions developed to facilitate data analysis and manipulation are described in this section. All of the Simetar© functions in this section are dynamic so if the historical data for a model or its stochastic variables change, the parameters are automatically updated. This feature is particularly useful when developing simulation models that can use different input data from one application to another. Another feature of Simetar© functions is that the formulas are cell locked so the formulas can generally be copied and pasted or dragged to new locations to speed up the data analysis process.
The dialog box used to calculate summary statistics for a variable (Figure 1) appears when the Summary Statistics menu item or icon Calculate summary statistics is selected. Click in the Select Range box and highlight the range (column or row) to analyze. Next click in the Output Range box and click the cell where the results are to appear. All of the statistics and their names (mean, standard deviation, coefficient of variation, minimum, maximum, lower and upper confidence interval, and sum) will be placed in the worksheet starting with the Output Range cell if the Add Output Labels button is clicked. The standard deviation can be calculated using either the population or the sample formula. The coefficient of variation, sum, count and autocorrelation coefficient are not calculated unless these statistics are specified by clicking on their boxes. Experiment with the dynamic nature of Simetar© by changing the values in the original data and observing the updated summary statistics.
 Calculate summary statistics
The Count and Sum options in the Summary Statistics menu are available for conditional counts and sums of the data. Consider the situation where you have 2,500 observations and need to know how many values are less than or equal to 10.0. Perform this calculation by clicking on Count , followed by clicking on the IF < = box, and then type the target value in the right hand box 10.0. The conditional count will appear with the other statistics.
The summary and test statistics are calculated using Excel functions so you can highlight the cells containing the statistics and drag (or copy/paste) the formulas to other locations. For example, if you need the statistics for 20 variables that are in columns B though U. Calculate the Summary Statistics for the data in column B and then drag the formulas to cells C through U. A sample output is provided in Step 1 of DemoSimetar-Data.
Data often comes in the wrong format or orientation. Data may be in an array when we need it in a matrix or vice versa. Sometimes we need to reverse the order of the data or concatenate arrays from different places in the worksheet. Functions to make these data manipulations easy have been included in Simetar©.
Reverse Order Function.
The order of the numbers in any array can be reversed using the array function =REVERSE( ). This function is useful for reversing a time series vector from newest value first to oldest value first. The function is used as follows: first highlight a blank column (or row) that matches the size of the original data, second type the command.
=REVERSE (Vector to Reverse)
and press the keys Control Shift Enter. This function can also be accessed by using the matrix operations icon Data manipulation and matrix operation functions and selecting the Reverse a Column or Row of Values option. See Step 18 in DemoSimetar-Mat for an example.
 Data manipulation and matrix operation functions
Dynamic Sort.
A dynamic sort function in Simetar© provides a sort tool that automatically re-sorts the data when changes occur in the original series. An array of numeric or text data can be sorted by itself or a matrix of data can be sorted where a specified column is sorted and carries the associated information for the other columns. The sort function, =MULTSORT( ), can be accessed directly or through the matrix functions icon (see Section 10.4). For an example see Step 13 of DemoSimetar-Data. The direct function is programmed as follows:
=MULTSORT(Array to Sort, Index Number, [Ascending Order], [Sort Rows])
where: Array to Sort is an array or matrix of values to sort, Index Number is an integer indicating the column or row to be used for the sort, Ascending Order is an optional ‘TRUE or 1’ for an ascending order sort and ‘FALSE or 0’ for a descending order sort, and Sort Rows is an optional value to indicating orientation of the data: ‘TRUE or 1’ indicates columns will be sorted and ‘FALSE or 0’ indicates rows will be sorted.
Concatenate Function.
The table lookup functions in Excel (VLOOKUP and HLOOKUP) are very useful in model development, but they require the data to be adjacent in the worksheet. This restriction often results in duplication of tables and data throughout the worksheet. To minimize this duplication, use the concatenate function. The =CONCAT() function allows you to specify a virtual table for use in table lookup functions. For example, if column A1:A20 contains the numbers 1-20 and column E1:E20 contains the searchable data the =CONCAT( ) can be used in VLOOKUP to locate in column 2 that is associated with the value 10 as follows:
=VLOOKUP (10, CONCAT (A1:A20, E1:E20), 2)
An example of =CONCAT( ) to construct a new matrix and in a VLOOKUP is included as Step 19 in DemoSimetar-Mat.
Delete Text in a Cell.
Delete Numbers in a Cell. When a cell has both numbers and text and you want the text, use the =DELNUM( ) function to extract the text. If cell A1 contains the string “1013 Sycamore Street” and you want the text in cell A2, then in A2 type:
=DELNUM(A1)
An example is provided in Step 14 of DemoSimetar-Data.
Box-Cox Transformation.
The =BOXCOX() function can be used to transform the data for a skewed distribution to make it approximately normally distributed. The function uses a user specified exponent to transform the data. The =BOXCOXEXP() function is provided to estimate an appropriate exponent. The format for the Box Cox transformation functions are:
=BOXCOX( Data Location, Power Value, [Shift to Plus])
where: Data Location refers to the location of the data series to be transformed, Power Value is the exponent for the transformation, and Shift to Plus is an optional term if the data are to be shifted to positive values enter ‘TRUE or 1’, otherwise enter ‘FALSE or 0’.
The =BOXCOX( ) function is an array function so highlight the appropriate number of cells and type the function on press Control Shift Enter. See Step 15 of DemoSimetar-Data for an example. Once a model has been estimated using a Box-Cox transformation, the =UNBOXCOX() function can be used to transform the forecast values back to original data. The reverse transformer function is:
=UNBOXCOX(Data Value, Power Value, Original Data Range, [Shift to Plus])
where: Data Value is a data point or data series that needs to be transformed back to the original distribution, Power Value is the exponent for the transformation, Original Data Range is the location for the original data that was transformed, and Shift to Plus is an optional term if the data are to be shifted to positive values enter ‘TRUE or 1’, otherwise enter ‘FALSE or 0’.
The maximum likelihood estimation of the Box-Cox transformation exponent function can be accomplished using the following function:
=BOXCOXEXP( Data Location, [Shift to Plus], [Lower Bound], [Upper Bound], [Max Iterations])
where: Data Location refers to the location of the data series to be transformed, Shift to Plus is an optional term if the data are to be shifted to positive values, Lower Bound is an optional minimum for the search routine, -2 is the default, Upper Bound is an optional maximum for the search routine, +2 is the default, and Max Iterations is an optional parameter for the search routine.
See Step 15 of DemoSimetar-Data for an example of all three BoxCox functions.
View Cell Formulas.
A Simetar© function is provided to show the formula typed in a particular cell. An advantage of using this function is that you can both see the formula for a cell, say B24, and you can see the value in B24. The =VFORMULA( ) function is dynamic and changes (updates itself) as rows and columns are added to or removed from the worksheet. The Simetar© function to view the formula in cell B24 can be typed into any cell (say, C24) as follows:
= VFORMULA (B24)
The view cell formulas function is demonstrated in Step 4 of DemoSimetar-Mat and in most steps of all Demo programs.
View All Formulas.
In the process of writing and documenting simulation models in Excel we often write formulas that need to be printed so they can be verified. Simetar© provides a function to easily view every cell in the worksheet as a formula, and then switch the worksheet back to values. This function is accessed by clicking the View all equations icon in the Simetar© toolbar. Once you have printed the sheet or checked the formulas, click the View all equations icon and your worksheet will return to the normal view.
![]() View all equations
View all equations
Workbook and Worksheet Name.
Functions in Simetar© have been provided to dynamically show the name of the workbook or the worksheet in a cell. These functions are handy for documenting a model and are demonstrated in cell A1 and C1 of DemoSimetar-Mat. The workbook name is shown in any cell that contains the following command:
=WBNAME( )
The worksheet name is shown in any cell that contains the following command:
=WSNAME( )
If you rename the workbook or the worksheet, the function updates the text in the cell.
Most data in an Excel workbook can be thought of as a matrix. Thirty-two Simetar© functions that facilitate the manipulation and analysis of data in matrices are accessed by clicking the Data Manipulation and matrix operation functions icon (Figure 2). The matrix functions are presented in alphabetical order:
Data Manipulation and matrix operation functions
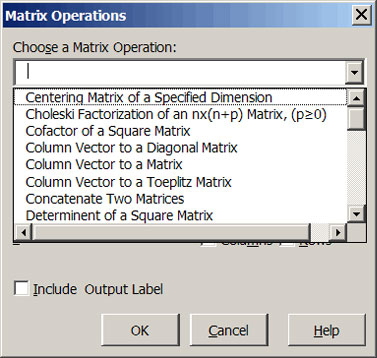 |
| Figure 2. Matrix Operation Menu |
| Center Matrix of a Specified Dimension Cofactor of a Square Matrix Column Vector to a Diagonal Matrix Column Vector to a Matrix Column Vector to a Toeplitz Matrix Determinant of a Square Matrix Eigenvalues of a Square Matrix Eigenvectors of a Square, Symmetric Matrix Equicorrelation Matrix of a Specified Dimension Exponential Power of a Matrix Factor a Square, Symmetric Matrix Generalized Inverse of a Matrix Inner Product of Two Matrices Invert a Nonsingular Square Matrix Kronecker Multiply Two Matrices Mahalanabis Distance of Two Data Matrices |
Matrix of 1s Matrix to a Vector Multiply Two Matrices Norm of a Matrix Orthoganalize a Matrix Rank of a Matrix Reduced Row Echelon Form of a Matrix Reverse a Column or Row of Values Row Echelon Form of a Matrix Sequence of Numbers Sort a Matrix by a Specified Column Sweep a Square Matrix on a Diagonal Element Trace of a Square Matrix Transpose a Matrix Wishart Matrix of Random Variables |
|
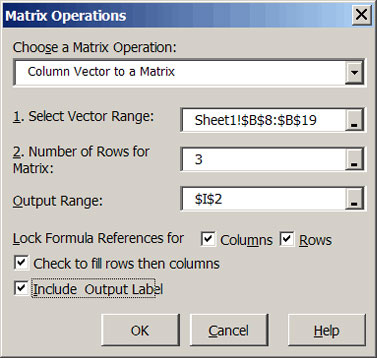 |
| Figure 3. Dialog Box for Changing a Vector to a Matrix. |
The most frequently used matrix functions are described in detail in this section. The Simetar© Matrix and array functions are dynamic so changes made to the data are automatically observed in the output functions. For example, changes to the input data will change the associated correlation matrix, the Cholesky decomposition matrix of the correlation matrix, and subsequent calculations. Most all of the matrix functions are demonstrated in the Excel workbook DemoSimetar-Mat.
Column Vector to a Matrix.
The Matrix Operations dialog box accessed by selecting the Data manipulation and matrix operation functions icon contains a function to Change a Column Vector to a Matrix (Figure 3). An example of this function is provided in Step 8 of DemoSimetar-Mat. The task of rearranging the data from vector to matrix format also can be accomplished using the Simetar© function =BLOCKIT( ). The parameters for the function, demonstrated in Figure 4 for the equation editor:
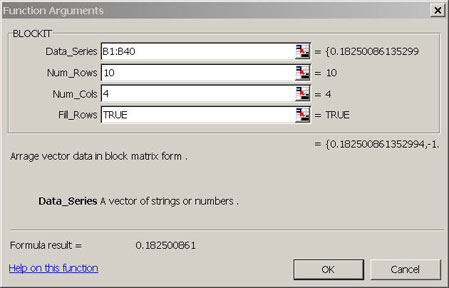
=BLOCKIT (Data Series, No. of Rows, No. of Columns, Fill Order)
Data manipulation and matrix operation functions
where: Data series is the location of the vector, No. of rows is the number of rows for the matrix, No. of columns is the number of columns for the matrix, Fill order is ‘1’ to fill by row and ‘0’ to fill by column. The =BLOCKIT( ) function is an array function so you must press Control Shift Enter after typing the right hand parenthesis. An example of converting a vector to a matrix is provided in Step 8 of DemoSimetar-Mat. This function is one which benefits from using Excel’s equation editor, as demonstrated in Figure 4. If you are not familiar with Excel’s equation editor, read Section 17.
| Figure 4. Example of Using Excel’s Equation Editor to Program the BLOCKIT Function. |
Convert a Matrix to a Vector.
The task of converting a matrix of weekly, monthly, or quarterly data to a vector for time series analysis is simplified with the Matrix to a Vector function. To use this function indicate the matrix to operate on and the output location for the vector. See Step 7 in the DemoSimetar-Mat workbook. This option uses the Simetar© function =STRETCHIT( ).
 |
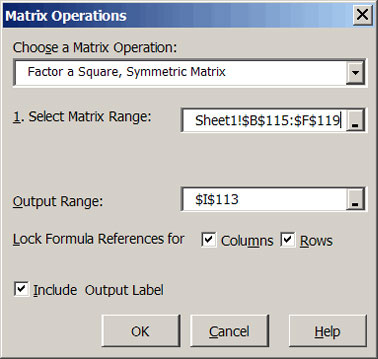
| Figure 5. Factor a Square Matrix Dialog Box. |
Factor a Square Matrix (Choleski Decomposition).
Simetar© can be used to factor the covariance or correlation matrix for advanced simulation applications using theData manipulation and Matrix operation functions icon. This function can also be used by directly applying the =MSQRT( ) function. To use the dialog box, first select the Factor a Square, Symmetric Matrix option and then specify the Output Range and the location of the matrix to factor (do not include labels) via the Select Matrix Range box (Figure 5). Copy the labels from the source matrix to the factored matrix as Simetar© does not use the row and column labels as input for this option. See Step 2 in DemoSimetar-Mat for an example.
Data manipulation and Matrix operation functions
The square root (or factor) of a square matrix can also be calculated using the Simetar© function. The array function is demonstrated in Step 3 of DemoSimetar-Mat. The =MSQRT( ) array function is used as follows:
highlight a square matrix on the worksheet that is the same size as the matrix to be factored, type =MSQRT (Location of Square Matrix), an example might be = MSQRT (C24:G29), and press the Control Shift Enter keys. This three key step is required because =MSQRT( ) is an array function.
Invert a Square Matrix (Excel).
The Invert a Nonsingular Square Matrix option in the Matrix Operations dialog box is demonstrated in Figure 6. (Simetar© uses Excel’s function at this point but provides a menu so you do not have to memorize the function name.) Select this option and then specify the input matrix (highlight only the numbers) and the output range for the upper left hand value, then click OK. The inverse of the input matrix will appear in the worksheet without row/column names. Copy and paste in the names if needed. An example of inverting a square matrix is provided in Step 1 of DemoSimetar-Mat.
 |
| Figure 6. Matrix Operations Dialog Box. |
Generalized Inverse of a Rectangular Matrix.
The Generalized Inverse of a Matrix function in the Matrix Operations dialog box uses Simetar’s function. Select this option and then specify the input matrix (highlight only the numbers) and the output range for the upper left hand value, then click OK. The inverse of the input matrix will appear in the worksheet without row/column names. Copy and paste in the names if needed. An example of inverting a square matrix is provided in Step 22 of DemoSimetar-Mat.
Sweep a Square Matrix on a Diagonal Element.
The Sweep a Square Matrix on a Diagonal Element option in the Matrix Operations dialog box performs this matrix operation. Select this option and then specify the input matrix (highlight only the numbers), the reference diagonal element row number (an integer), and the output range for the upper left hand value, then click OK. See Step 23 in workbook DemoSimetar-Mat for an example.
Transpose a Matrix (Excel).
A matrix can be transposed by selecting the Transpose a Matrix option in the Matrix Operations dialog box, specifying the matrix to transpose and the upper-left hand cell to anchor the output matrix. This procedure simplifies Excel’s TRANSPOSE function by eliminating the need to block the area for the transposed matrix. See Step 6 of DemoSimetar-Mat for an example.
Multiply Two Matrices (Excel).
Excel’s matrix multiplication, MMULT, function is made easier by selecting the Multiply Two Matrices option in the Matrix Operations dialog box. The function is demonstrated in Step 10 of DemoSimetar-Mat.
Kronecker Multiply Two Matrices.
The Kronecker product of two matrices is accomplished by selecting this option in the Matrix Operations dialog box. The function is demonstrated in Step 12 in the workbook DemoSimetar-Mat.
Convert a Vector to a Diagonal Matrix.
In simulation it is useful to convert a vector of standard deviations to a diagonal matrix. The Simetar© function =MDIAG( ) can be used to convert an array to a diagonal matrix using the Column Vector to a Matrix option in the Matrix Operations dialog box. A demonstration of how to convert an array to a diagonal matrix is provided in Step 20 of the DemoSimetar-Mat.
Find the Determinant of a Square Matrix.
The determinant of a square matrix can be calculated by selecting the Determinant of a Square Matrix option in the Matrix Operations dialog box. The Excel function =MDETERM (square matrix) is used for this calculation. An example is provided in Step 5 of DemoSimetar-Mat.
Find the Eigen Values of a Square Matrix.
The Eigen values for a square matrix can be calculated by selecting the Eigenvalues of a Square Matrix option in the Matrix Operations dialog box. An example is provided in Step 24 of DemoSimetar-Mat.
Find a Cofactor of a Square Matrix.
The cofactor of a square matrix can be calculated by selecting the Cofactor of a Square Matrix option in the Matrix Operations dialog box. An example is provided in Step 25 of DemoSimetar-Mat.
Find the Trace of a Square Matrix.
The trace of a square matrix (or the sum of the diagonal elements) can be calculated using the Trace of a Square Matrix option in the Matrix Operations dialog box. The trace can also be calculated using the Simetar© function =MTRACE (square matrix). An example of calculating the trace of a square matrix is provided in Step 4 of DemoSimetar-Mat.
Find the Rank of a Matrix.
The rank of a matrix can be calculated to determine if the matrix is singular. If an NxN matrix has an N rank if it is nonsingular. The rank of a square matrix can be calculated using the =MRANK( ) function or the Matrix Operations dialog box Rank of a Matrix option. An example of this function is provided in Step 16 of the DemoSimetar-Mat workbook.
Find the Norm of a Matrix.
The norm (the square root of the inner product of the matrix) can be calculated using the find the Norm of a Matrix option in the Matrix Operations dialog box. This option uses the =MNORM( ) function and is demonstrated in Step 9 of the DemoSimetar-Mat workbook.
Find the Inner Product of Two Matrices.
The inner product of two matrices can be calculated directly using this option in the Matrix Operations dialog box. If two matrices are of the same dimension, MxN, the inner product scalar is the sum of the products of the corresponding elements. The scalar can be calculated directly using the function =MIP(matrix 1, matrix 2) and is demonstrated in Step 11 of DemoSimetar-Mat.
Create an Identity Matrix.
An indemnity matrix of dimension NxN can be generated using the =MIDEN( ) function in Simetar©. The format for the function is =MIDEN (dimension) where dimension is a scalar to specify the number of rows in the square identity matrix. An example of =MIDEN( ) is provided in Step 17 of DemoSimetar-Mat.
Create a Sequence of Numbers.
A sequence of numbers in an array can be created using the =SEQ( ) function. The =SEQ( ) returns a column of numbers that follow any sequence you specify. The function is programmed as:
=SEQ(No. of Values, Starting Value, Interval or Increment)
where: No. of Values is the number of cells to be highlighted, Starting Value is the first value in the sequence, and Interval or Increment is the interval between each value.
For example the sequence of number for 10, 20, 30, …, 200 is generated by programming the function as =SEQ(20,10,10) and a sequence of 2, 4, 6, …, 20 is generated by programming the function as =SEQ(10, 2, 2). See Step 30 in DemoSimetar-Mat for an example.
Create a Matrix of Ones.
In statistics a J matrix is an array or matrix with a 1.0 in each cell. The Simetar© function =MJ( ) is used to create a J matrix. To create a 10X1 array of 1.0s highlight 10 cells in column and type the function =MJ(10). To create a 10X10 matrix of 1.0s, highlight a 10 cells in 10 columns and type =MJ(10,10). Be sure to hit the Control Shift, Enter keys after typing the =MJ( ) function as it is an array function. See Step 29 in DemoSimetar-Mat for an example.
Create a Centering Matrix. The =MCENTER() array function that creates an NxN centering matrix when N is specified as the dimension. See Step 28 in DemoSimetar-Mat for an example.
Create an Equicorrelation Matrix. The =MEQCORR() array function generates an NxN equicorrelation matrix using any specified correlation coefficient. The =MEQCORR( ) function is an array function so you must highlight the cells for the square equicorrelation matrix and end the function by hitting Control Shift Enter. The function is programmed as =MEQCORR( Rho). Where Rho is the correlation coefficient. See Step 27 in DemoSimetar-Mat for an example of a 4X4 equicorrelation matrix using 0.345 as the correlation coefficient.
Create a Toeplitz Matrix. The =MTOEP() array function creates a square symmetric Toeplitz matrix given a column or row of data. To create a Toeplitz matrix of an array in A1:A4, highlight a 4X4 array and type the function as =MTOEP(A1:A4). Be sure to press Control Shift Enter as this is an array function. See Step 26 in DemoSimetar-Mat for an example.